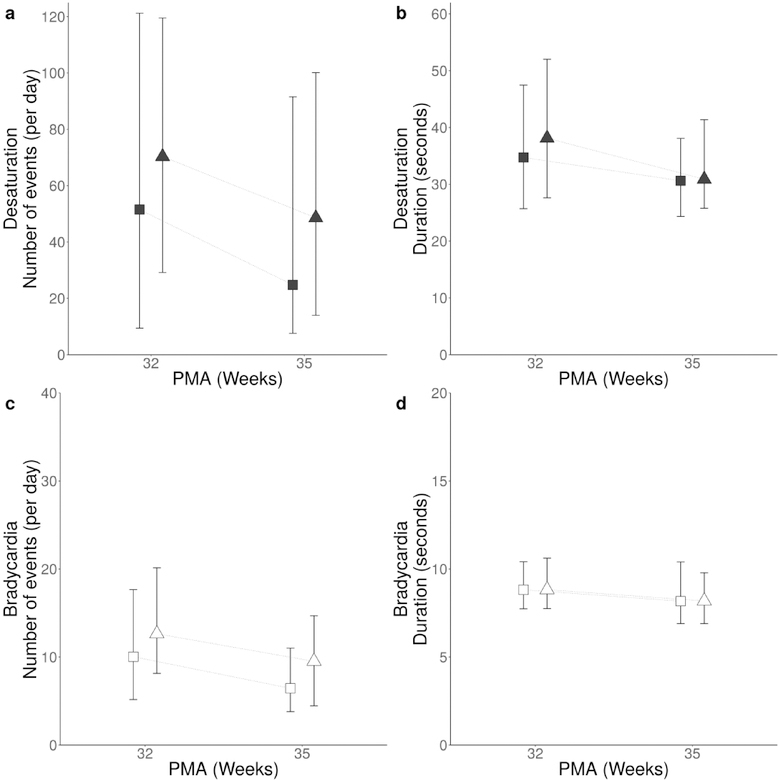
Figure 1: Number and duration of bradycardia and desaturation events at 32 and 35 weeks PMA by sex.
Median daily number and duration of desaturations at 32 weeks PMA (32 0/7 to 32 6/7) and 35 weeks PMA (35 0/7 to 35 6/7) are shown as filled symbols (panels A and B); triangles for males, squares for females. Bradycardia number and duration at 32 and 35 weeks PMA are shown as open symbols (panels C and D). Error bars indicate interquartile range.

