Figure 3.

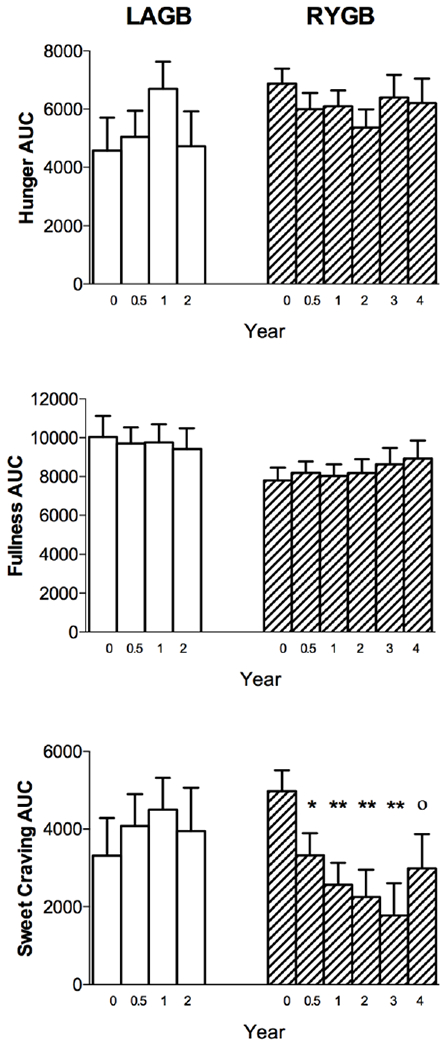
Visual analogue scale results of appetitive ratings. LAGB = open bars; RYGB = cross-hatched bars. Values are reported as mean AUC ± SEM. *P < 0.05; **P < 0.01; °P = 0.058 compared with preoperative within-group value.

Visual analogue scale results of appetitive ratings. LAGB = open bars; RYGB = cross-hatched bars. Values are reported as mean AUC ± SEM. *P < 0.05; **P < 0.01; °P = 0.058 compared with preoperative within-group value.