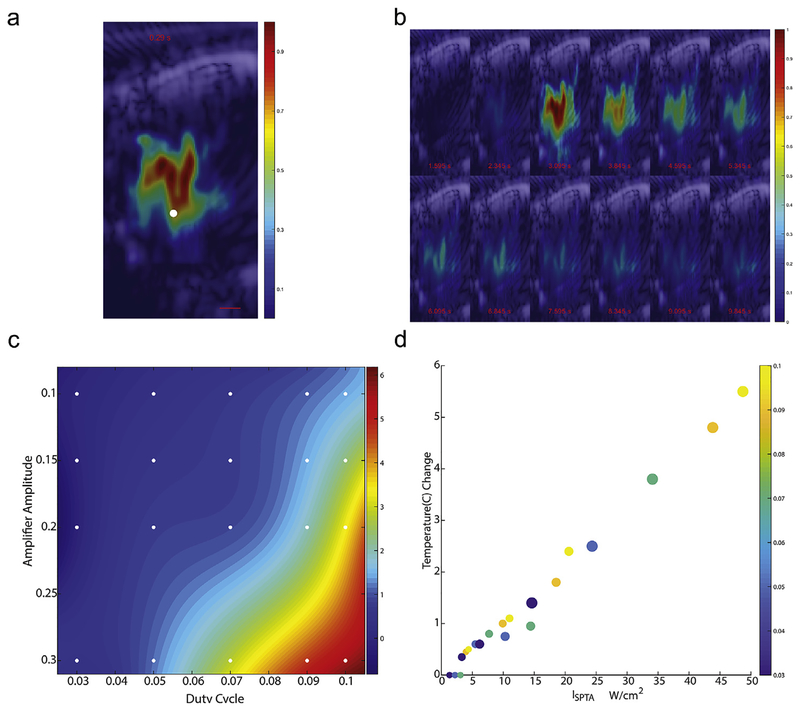
Fig. 3. Temperature field created by TFUS.
a: A spatial profile of the initial heating rate induced by a 1-sec tFUS beam at 50% DC with colorbar indicating temperature in Celsius and white dot at the target focus. b: montage of tFUS-induced temperature profiles at 0.4 s intervals (timestamps with respect to tFUS application at 0 s). The duty cycle of this test shot is 50% rather than the typical 10% c: The interpolated temperature surface of the amplitude-duty cycle parameter space is plotted over a gradient with reference markers indicating the locations of measured steady-state temperature changes from a image-guided thermocouple. d: Steady-state temperature changes are plotted across the corresponding duty cycles (displayed in color) and amplifier amplitudes (size of the marker) against the SPTA intensity.

