
Figure 4.
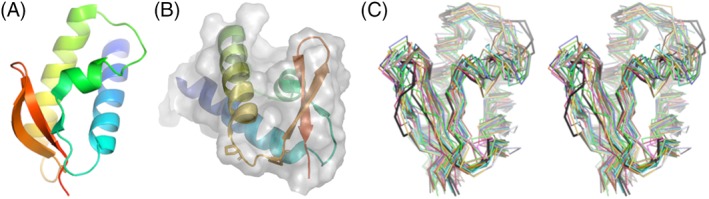
Crystal structure and models for LP1413. A, Ribbon diagram of the crystal structure, shaded from blue (N‐terminal) to red (C‐terminal). B, The crystal structure from a slightly different viewpoint, with a transparent molecular surface showing the hydrophobic pocket (roughly center) and the conserved Proline residues of the helix 3––strand 2 turn shown as sticks. C, Superposition of the top 40 predicted models (wall‐eyed stereo), from the same viewpoint as in panel A. The two chains from the asymmetric unit of the crystal structure are shown in black