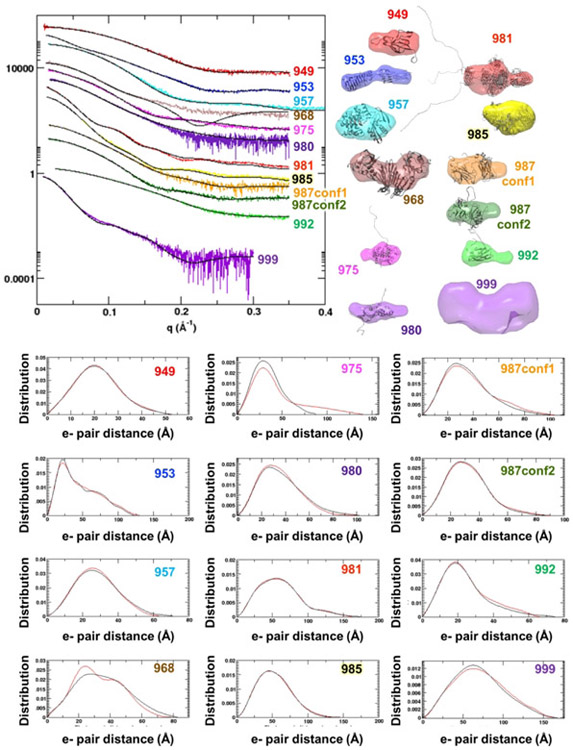
Figure 1.
SAXS data for CASP13 targets. (Left upper Panel) Reciprocal space experimental SAXS curves (colored) are overlaid with the predicted scattering (black) from an ensemble of atomic models, found to best match the experimental data. SAXS curves can be scaled without losing information content, so the SAXS curves have been offset for visual clarity. The atomic model(s) are full-length models, based on the crystal structure or when appropriate, multimeric models based on the crystallographic lattice. (Right upper panel) Ab initio shape reconstructions based on the SAXS data and overlaid with a single representative atomic model. (Bottom panel) Real space SAXS curves for different targets (abbreviated CASP target IDs are provided on the graphs).

