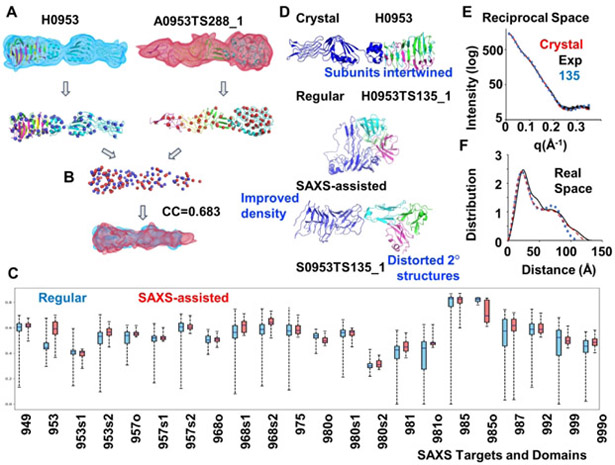
Figure 3.
Density correlation score. (A.) Atomic models of the target (left) and a prediction (right) are converted into low-resolution density maps and fitted with Gaussian mixture models (GMM) - shown in blue and red respectively. Centers (mean values) of the Gaussians are shown as spheres. (B) Two GMMs are superimposed so that overlap of the two distributions is maximized. Density correlation score is the correlation of the corresponding superposition of the simulated densities from A. (C) Box plots for the density correlation scores for all regular (by any group) and SAXS-assisted targets. (D) Target H0953 atomic models of the crystal structure and of an example of regular and the corresponding SAXS-assisted model from the Grudinin group. The SAXS-assisted model has a similar elongated shape, but secondary structure elements are clearly disrupted. This example also highlights how the subunits are entwined, and the predicted models appear to have been folded independently and placed together.(E and F) Corresponding to D, overlay of H0953 experimental data with SAXS curves predicted for crystal structure and for SAXS-assisted models in reciprocal and real space.

