Fig. 6.
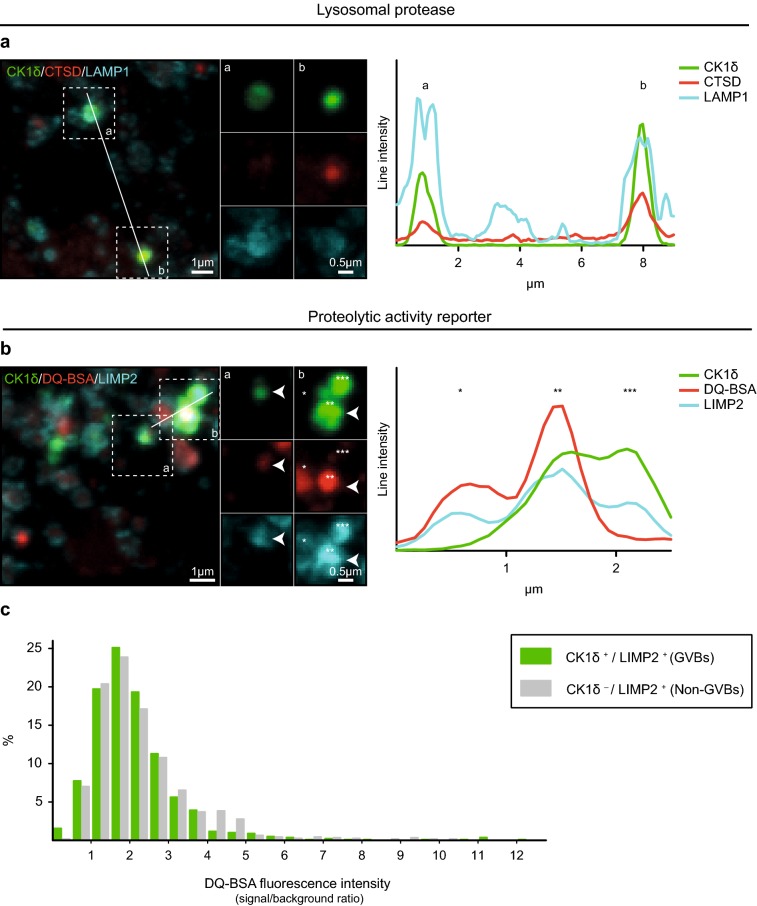
GVBs are lysosomal structures that contain degraded endocytic cargo. Tau pathology was induced in primary mouse neurons expressing tau P301L by treatment with PFFs. a Representative confocal images plus zooms and fluorescence intensity profiles of immunostaining with the GVB core marker CK1δ (green), the lysosomal protease CTSD (red) and the GVB membrane marker LAMP1 (cyan). See Supplementary Table 3 in Online Resource 1 for an overview of the number of cells analyzed. b Representative confocal images plus zooms and fluorescence intensity profiles of immunostaining with CK1δ (green) and LIMP2 (cyan) and the live cell reporter DQ-BSA (red). DQ-BSA fluorescence designates sites of proteolysis. Zoomed areas are indicated in the merged image. Intensity profiles are determined along the line segment shown as a white bar in the merge. c Quantification of b showing the DQ-BSA fluorescence signal in LIMP2-delineated structures negative or positive for the GVB marker CK1δ (see “Materials and methods” for analysis details). Frequency distribution of the DQ-BSA fluorescence intensity signal/cytosolic background ratio is presented as the percentage of structures within the specified bin. Bin width is 0.5. N = 3 independent experiments, N = 760 CK1δ-positive (GVBs) and 1038 CK1δ-negative (non-GVBs) LIMP2-positive structures analyzed

