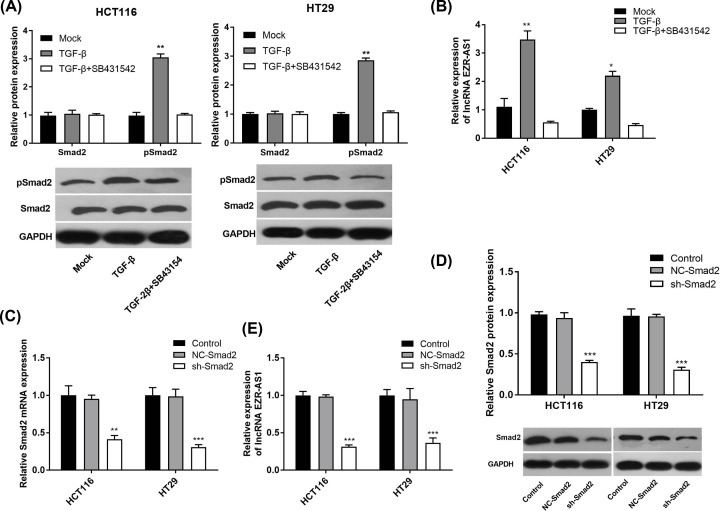
Figure 6. The expression of Smad2, phosphorylated Smad2 (pSmad2) and long non-coding RNA (lncRNA) EZR-AS1 in colorectal cancer cells.
(A) Relative expression of Smad2 and pSmad2 in HCT116 cells and HT29 cells (protein level) (N = 3). (B) Relative expression of lncRNA EZR-AS1 in HCT116 and HT29 cells (mRNA level) (N = 5). Mock, normal cells without treatment; TGF-β, cells treated with 10 ng/ml TGF-β; TGF-β + SB431542, cells treated with 10 ng/ml TGF-β and 10 µM SB431542. *P<0.05; **P<0.01 vs. Mock and TGF-β + SB431542. (C) Relative expression of Smad2 in HCT116 and HT29 cells (mRNA level) (N = 5). (D) Relative expression of Smad2 in HCT116 and HT29 cells (protein level) (N = 3). (E) Relative expression of lncRNA EZR-AS1 in HCT116 and HT29 cells (mRNA level) (N = 5). Control, normal cells without treatment; NC-Smad2, cells transfected with Smad2 shRNA negative control; sh-Smad2, cells transfected with Smad2 shRNA. *P<0.05; **P<0.01; ***P<0.001 vs. Control and NC-Smad2.

