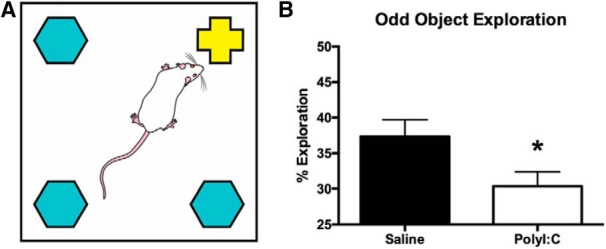
Figure 3.

Experimental setup and results of the oddity discrimination task. A, Schematic of the white square arena used to conduct the oddity discrimination task showing the arrangement of three identical objects and one different, or odd, object. The schematic has been published previously (Lins et al., 2018). B, Bar graph displaying the percentage of total object exploration spent examining the odd object. Prenatally polyI:C-exposed adult offspring displayed significantly less oddity preference than offspring exposed to saline prenatally (*p < 0.05). (Figure 5 from Lins et al., 2019.).
