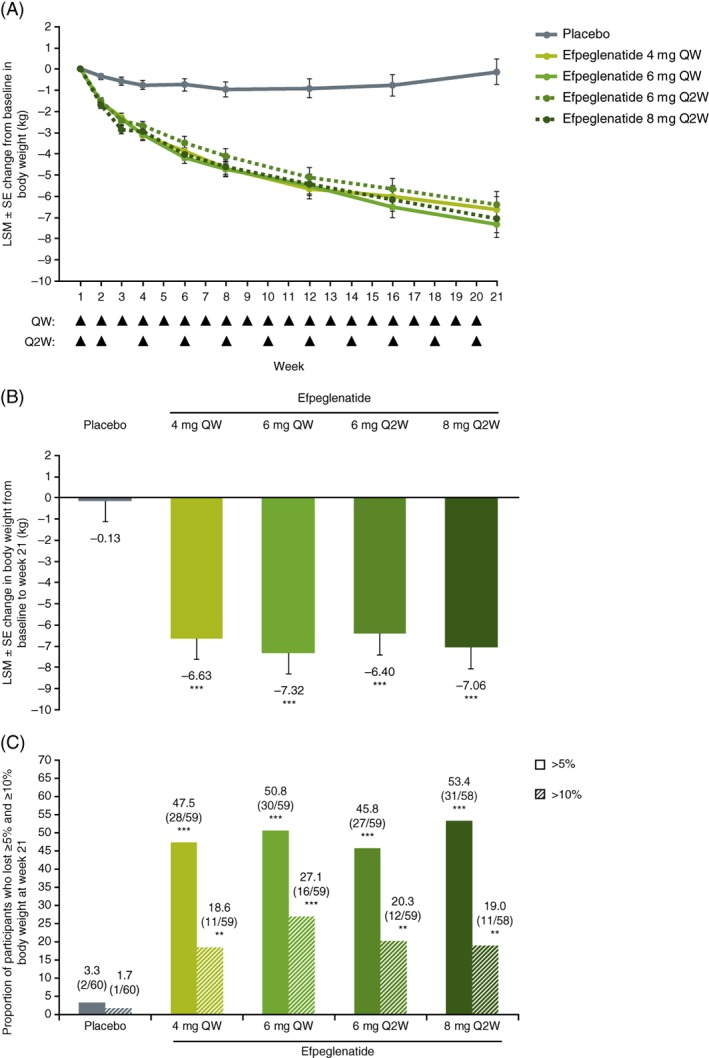
Figure 1.

A, Least squares mean (LSM) change in body weight from baseline over the 20‐wk treatment period, B, Overall reduction at week 21 and C, Percentage of participants who lost at least 5% and 10% body weight at week 21 (full analysis set). Week 1 indicates baseline. Arrows indicate weeks of injection, which occurred at the beginning of the week. **P < 0.01 vs. placebo; ***P < 0.0001 vs. placebo. Abbreviations: Q2W, once every 2 wk; QW, once weekly
