Figure 8.

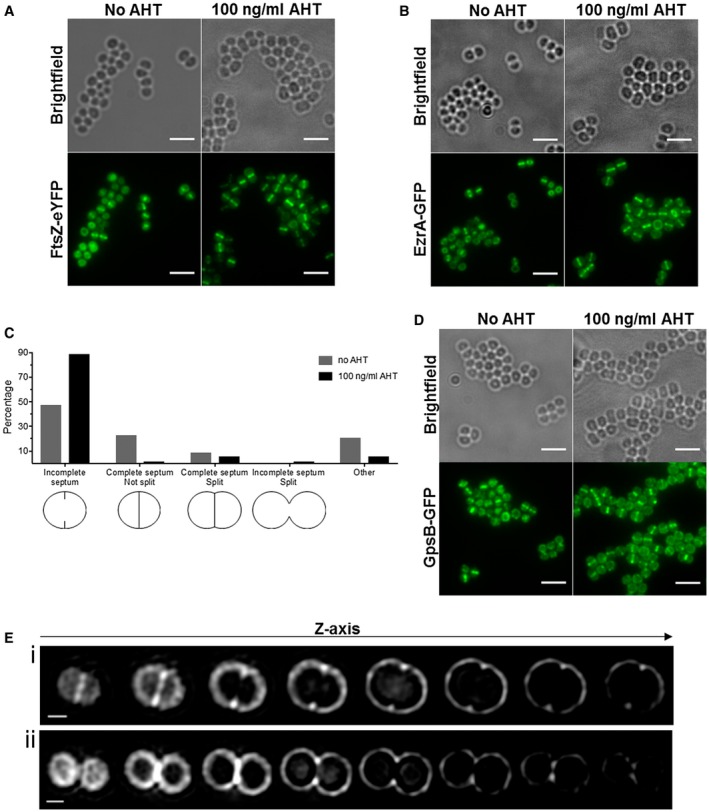
SosA does not impair the localization of cell division proteins and septum formation initiation. A. Localization of FtsZ‐eYFP in SJF4694 (JE2 pSosA pCQ11‐FtsZ‐eYFP) grown in the absence and presence of 100 ng ml−1 of AHT for 45 min. B. EzrA‐GFP localization in SJF4697 (JE2 pSosA ezrA‐gfp+) grown in the absence or presence of 100 ng ml−1 AHT for 45 min. C. Percentages of JE2 pSosA cells exhibiting incomplete, complete, complete split or incomplete split septa (n = 573 for no AHT, n = 607 for 100 ng ml−1 of AHT; organisms either isolated or co‐adhered in pairs; other represents staining in indistinct shape) after incubation with or without AHT for 45 min. D. GpsB‐GFP localization in SJF700 (JE2 pSosA gpsB‐gfp+) grown in the absence or presence of 100 ng ml−1 of AHT for 45 min. All fluorescence images (A, B and D) are average intensity projections and scale bars represent 3 um. E. 3D‐SIM Z‐stack images of JE2/pSosA grown with 100 ng ml−1 of AHT for 45 min and labeled with Alexa Fluor 647 NHS ester. (i) A cell with initiated septum formation and (ii) a cell splitting into daughter cells without finishing a septal disc. Scale bars represents 0.5 µm.
