
Figure 2.
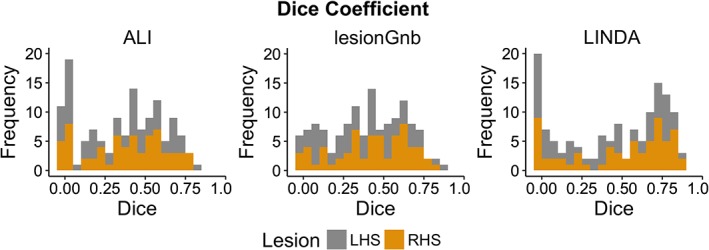
Distribution of dice similarity coefficient values for automated approaches. Histograms of all dice similarity coefficient values (N = 132) for each automated lesion detection approach; left hemisphere stroke (LHS) in gray; right hemisphere stroke (RHS) in gold [Color figure can be viewed at http://wileyonlinelibrary.com]