
Figure 7.
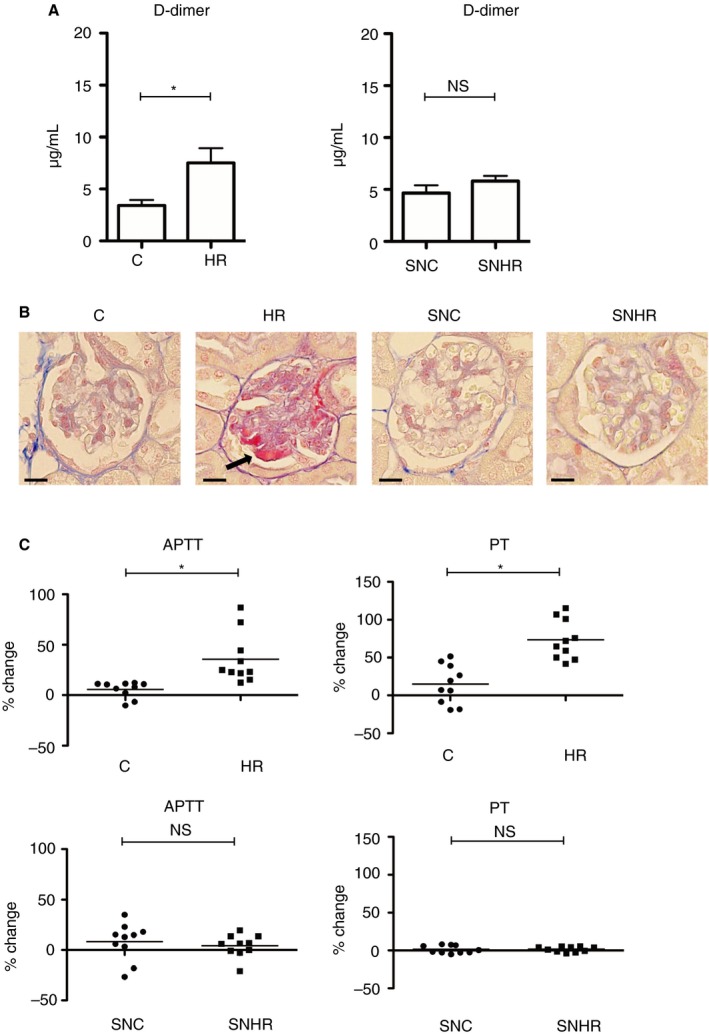
Effect of rewarming on the coagulation state in hypothermic mice. A, D‐dimer levels analyzed by ELISA (n = 10 per experimental group, *P < .05). B, Representative microthrombosis in renal glomeruli stained with Martius Scarlet Blue. In HR‐mice, glomerular thrombi are stained red. The scale bars indicate 20 μm. C, APTT and PT of mice plasma (n = 10 per experimental group, *P < .05). The error bar indicates the SD. APTT, activated partial thromboplastin time; C, control; H, hypothermic; NS, no significance; PT, prothrombin time; R, rewarmed; SN, splenectomized