
Figure 3.
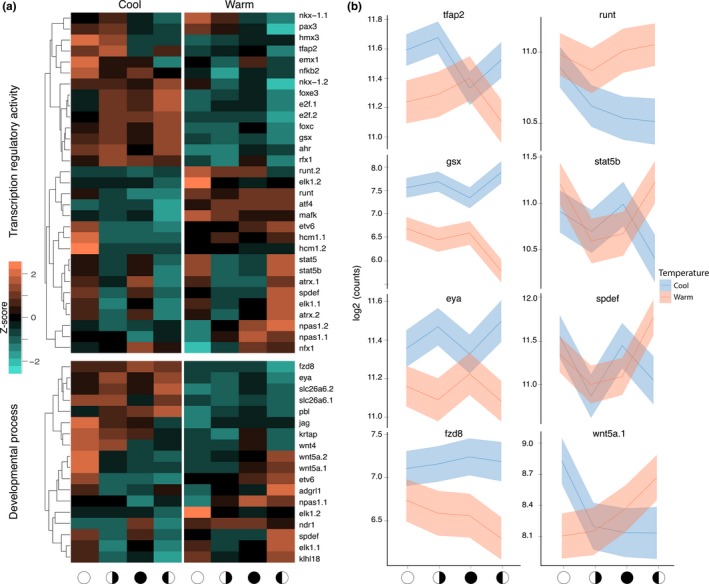
The interaction of temperature and lunar rhythms. (a) Differentially expressed genes from the interaction of temperature and the lunar phase, annotated as “Transcription regulatory activity” and “Developmental process.” Methods were as in Figure 2. (b) Daily expression plots of select genes. Solid lines represent the mean counts and shaded areas (blue and red) are 95% confidence intervals. The x‐axis indicates the lunar phase: open circle indicates a full moon, filled circle is a new moon and half circles represent the appropriate quarter moons