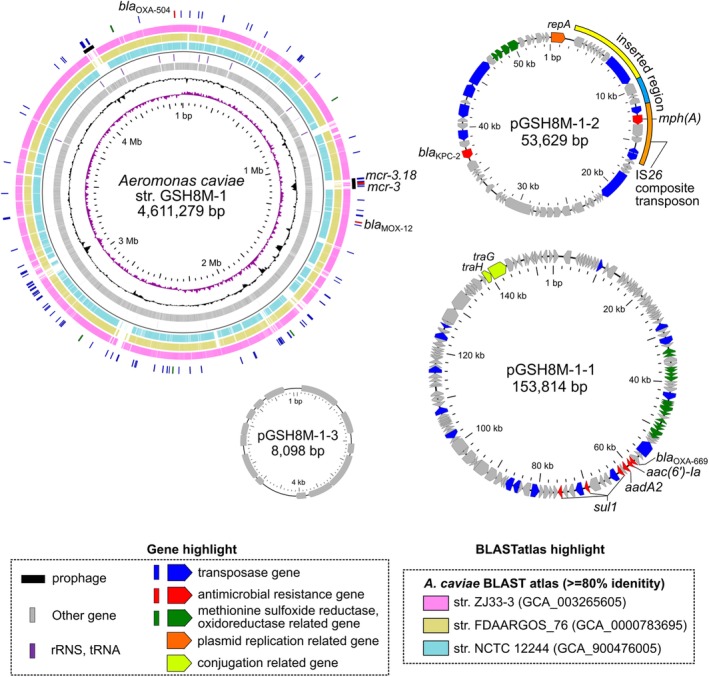
Figure 2.

Schematic circular representation of complete genome sequences of KPC‐2‐producing A. caviae GSH8M‐1. See the legend to Fig. 1 for methods and descriptions of representations. Slots 5–7, BLASTatlas conserved gene analysis indicates three relative strains (see also Supporting Information Fig. S2). Marked acquired elements in pGSH8M‐1‐2 compared to pGSH8‐2 are highlighted in the outer slot.
