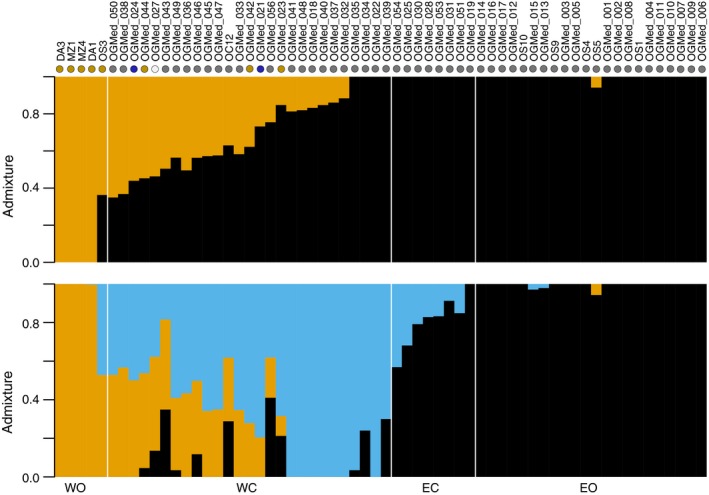
Figure 2.

Admixture proportion in wild and cultivated olives (n = 62) with K = 2 and 3 inferred from 536 341 SNPs. On the top of the graph, coloured dots indicate the chlorotype of each accession. Grey: E1; brown: E2; blue: E3; white: L1 (Data S1). Accessions were split in four different populations: WC and EC for western and eastern oleasters, respectively, based on their geographic origin and WC and EC for western and eastern cultivars, respectively, based on PCA (Figure 1) and structure results (this figure) along with chloroplastic genotyping data (Data S1).
