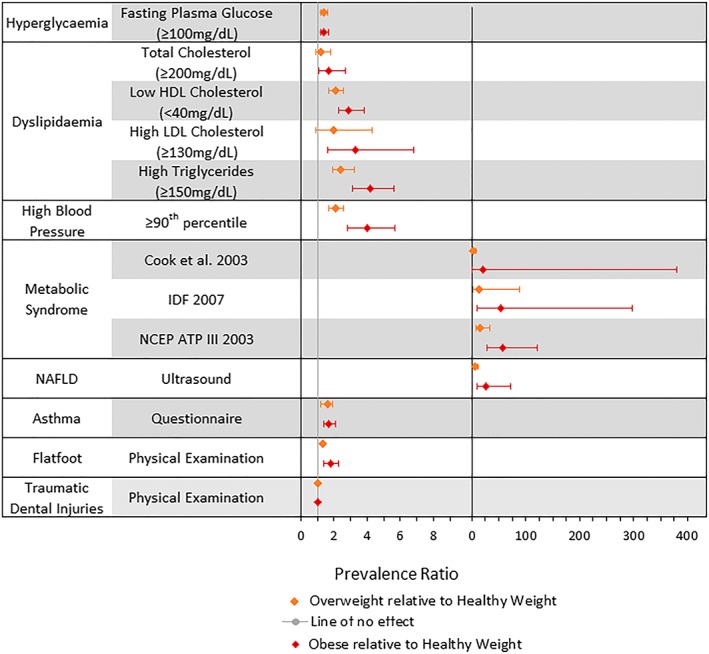
Figure 2.

Average random effects estimates of prevalence ratios and 95% confidence intervals for the comorbidities/comorbidity indicators. Left‐hand side excludes metabolic syndrome and nonalcoholic fatty liver disease (NAFLD) because of differences in scale [Colour figure can be viewed at http://wileyonlinelibrary.com]
