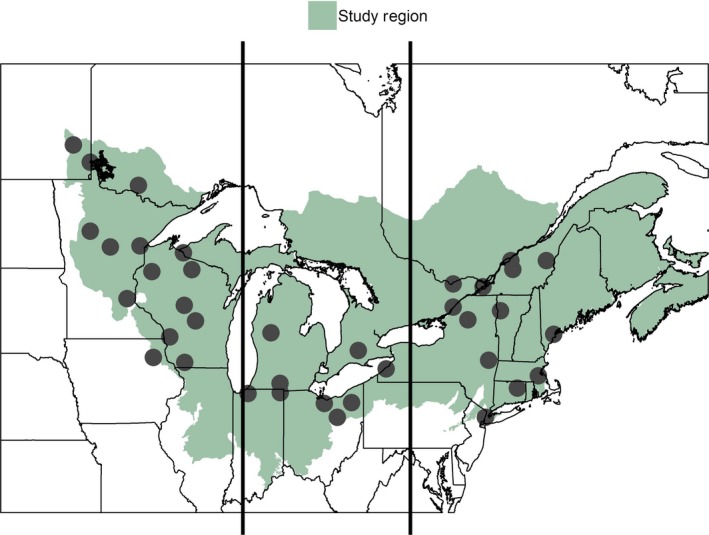
Figure 1.

Map of study area. Points indicate locations of weather stations included in the analysis located within as defined by Level II ecoregion classifications. Vertical lines show three subregions delineated for the purpose of examining broad spatial differences among trends.
