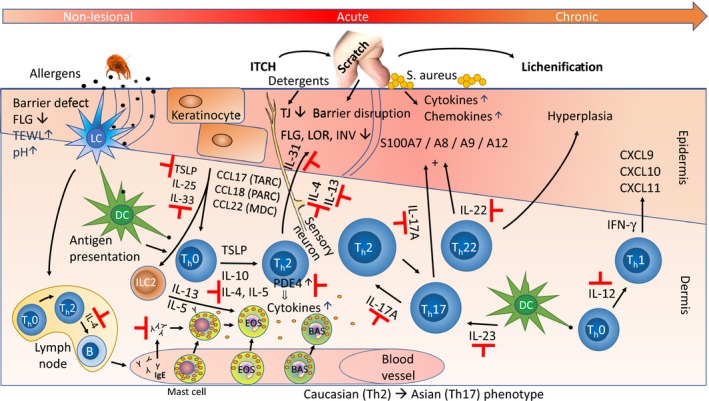
Figure 2.

Pathways in the pathogenesis of AD. Epidermal barrier defects, which are partly due to FLG mutations, are associated with increased trans‐epidermal water loss [TEWL), increased skin pH, and penetration of epicutaneous allergens, such as dust mite debris. When the allergens encounter antigen‐presenting epidermal Langerhans cells (LCs, for an excellent review of the interplay between LCs and the epidermis, see Clayton et al. 259] and dermal dendritic cells (DCs), this causes immune activation and recruitment of inflammatory cells, including ILC2 [type 2 innate lymphoid cells 260] and type 2 helper T‐cells (Th2) that produce and release IL‐4, IL‐5, IL‐13, and IL‐31. These cells are considered part of the skin‐associated lymphoid tissue (SALT), the immunologically active cutaneous microenvironment, a concept which was proposed already in 1983 by Streilein 261. IL‐4 and IL‐13 suppress expression of terminal differentiation genes (such as FLG, LOR, INV), and also of tight junction (TJ) genes 208 leading to barrier disruption, while IL‐31 also acts directly on sensory neurons, triggering the itch–scratch cycle. This further damages the epidermis, increasing the risk of penetration by pathogens like Staphylococcus aureus. The stressed keratinocytes release TSLP, IL‐25, and IL‐33 that also drive Th2 differentiation. The Th2 cytokines induce IgE production in B cells and subsequently, release of inflammatory mediators (e.g. histamine) from activated (IgE bound) mast cells, basophils, and eosinophils. Th22 cells release IL‐22, which causes epidermal hyperplasia, and also, in synergy with IL‐17 – released from Th17 cells – induces expression of a subset of S100 family proteins. Acute AD lesions are characterized by a Th2 skewed (Th2, Th17, Th22) response, while chronic AD, which is often lichenified (thickened) by chronic scratching, progressively activates the Th1 axis with IL‐12 release, IFN‐γ expression and induction of chemokines (like CXCL9/CXCL10/CXCL11). Indicated with ⊣ are targets of approved and emerging drugs (see Table 2 for a detailed list). Figure modified, mainly from Vakharia & Silverberg 262, based on the original by Leung 2000 263 and 2004 264. For other representations, see Noda et al. 134, Paller et al. 265, Weidinger et al. 9, Lee et al. 9, 266, and Brunner et al. 267, 268.
