Figure 2.

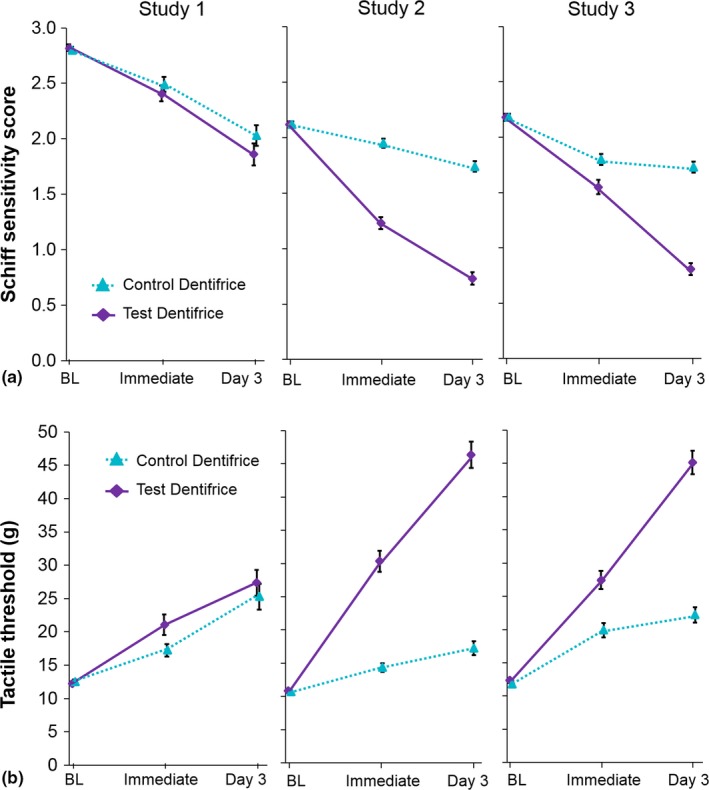
Mean (± standard error) a) Schiff sensitivity scores and b) tactile threshold (intent‐to‐treat population). Data offset for clarity; BL, baseline; tactile threshold values range from 0 to 80 g

Mean (± standard error) a) Schiff sensitivity scores and b) tactile threshold (intent‐to‐treat population). Data offset for clarity; BL, baseline; tactile threshold values range from 0 to 80 g