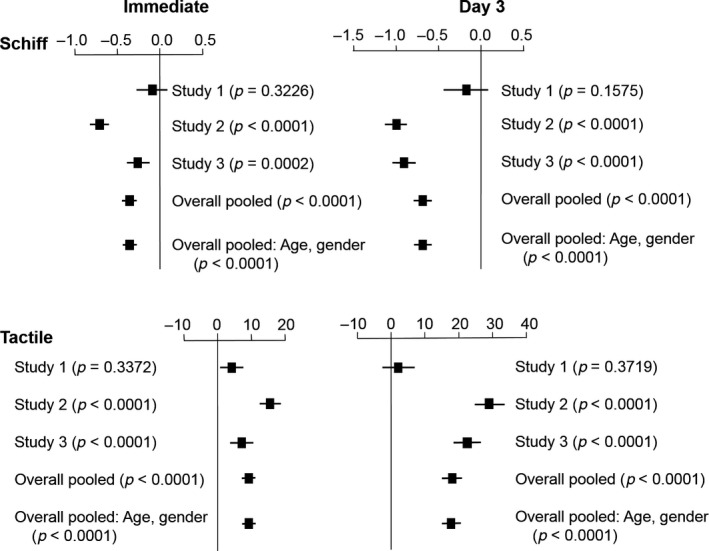
Figure 3.

Schiff sensitivity score and tactile threshold mean between‐treatment difference and 95% CIs for each individual study and pooled analysis including age, gender and baseline score as factors (intent‐to‐treat population), immediately after fingertip application and on Day 3. In Study 1, mean and 95% CIs from ANCOVA, p‐value from nonparametric analysis
