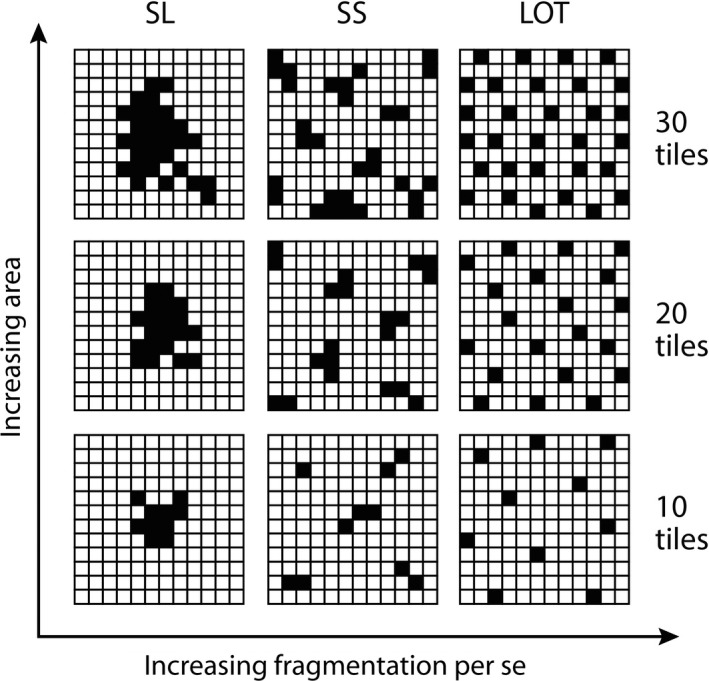
Figure 2.

Experimental plots (2.4 × 2.4 m) representing the spatial configurations of tiles (habitat; black cells) installed on seawall substrate (matrix; white cells). Variation in area is represented by rows (10 tiles = 7% area; 20 tiles = 14%; and 30 tiles = 21%) while variation in fragmentation is represented by columns (SL, single large; SS, several small; and LOT, lots of tiny).
