Figure 4.

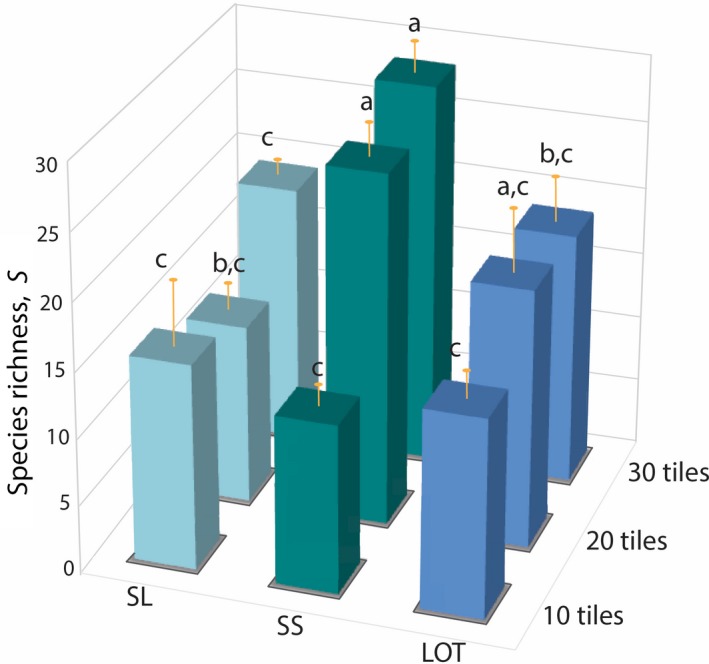
Species richness (S [mean + SE]) found within the nine different plot configurations. Different letters indicate significant differences among means (SNK tests, P < 0.05).

Species richness (S [mean + SE]) found within the nine different plot configurations. Different letters indicate significant differences among means (SNK tests, P < 0.05).