
Figure 5.
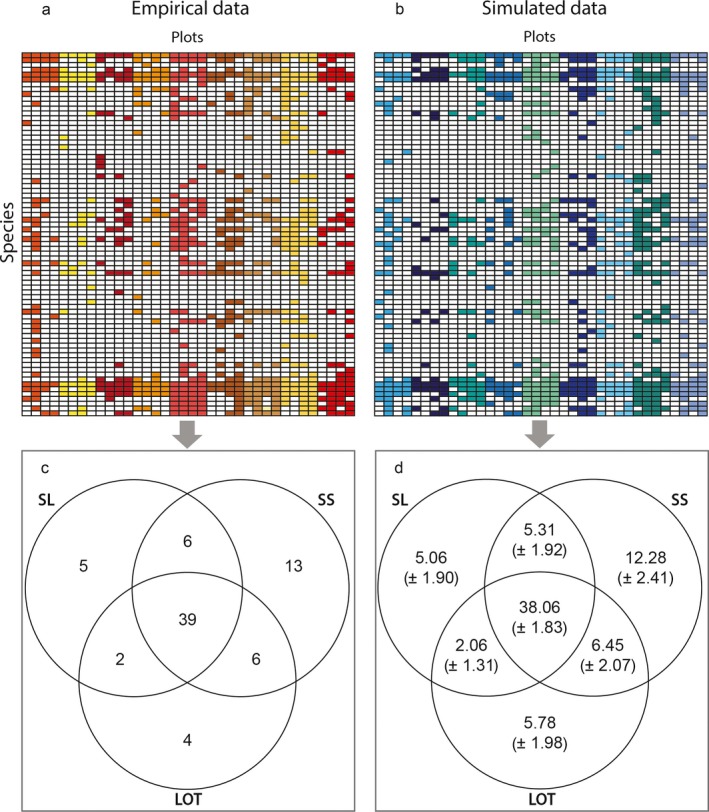
(a) Species (presence–absence) co‐occurrence matrix based on our empirical data, and a Venn diagram showing counts of species associated with each possible combination of plot configurations; (b) null matrix model based on randomizing the presence–absence matrix while maintaining the row and column sums and the mean species richness (n = 10,000; ±SD), along with the corresponding Venn diagram. The observed Venn diagram (c) is statistically indistinguishable from the Venn diagrams of the randomized co‐occurrence matrices (d).