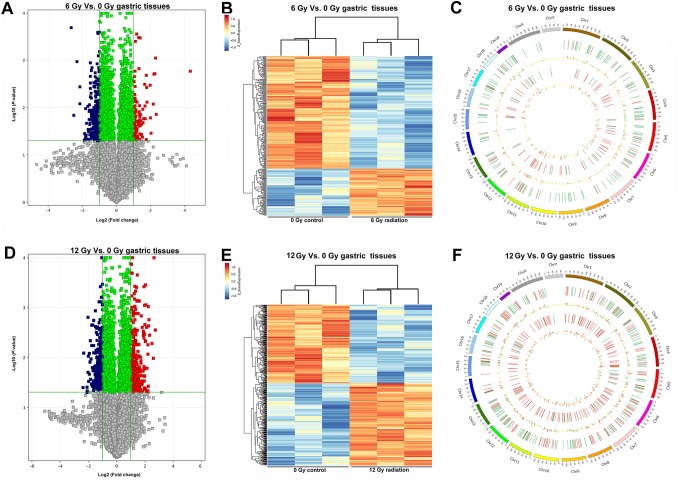
Figure 2.
mRNA and lncRNA expression profiling of gastric tissue samples subjected to 6 and 12 Gy X-ray irradiation. A, The volcano plot of mRNA and lncRNA profiling between 6 Gy irradiation and 0 Gy control gastric tissues of mice. B, The heatmap of the significant mRNA and lncRNA expression patterns in the control (0 Gy) and 6 Gy group of gastric tissue samples. C, Differential expressed gene distribution in mouse chromosomes following 6 Gy irradiation. Red and blue bars represent upregulated and downregulated differential expressed genes, respectively. D, The volcano plot of expressed mRNAs and lncRNAs between control and 12 Gy irradiated gastric tissues. E, The heatmap of the significant mRNA and lncRNA expression patterns in the control and 12 Gy group of gastric tissue samples. F, Differential expressed gene distribution in mouse chromosomes following 12 Gy irradiation. lncRNA indicates long noncoding RNA; mRNA, messenger RNA.

