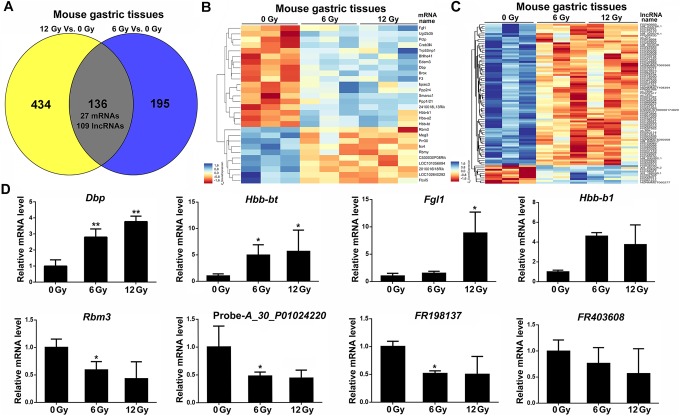
Figure 3.
Common dysregulated mRNAs and lncRNAs in irradiated gastric tissues. A, Venn diagram significant differently expressed genes (lncRNA and mRNA) in 0, 6, and 12 Gy irradiated gastric tissue samples. B, The heatmap of the common significant mRNA expression patterns in control and irradiated groups. C, The heatmap of the common significant lncRNA expression patterns in control and irradiated groups. D, Real-time PCR analysis of relative mRNAs and lncRNAs levels. Relative RNA level was normalized to that of GAPDH. *P < .05; **P < .01, compared with the nonirradiated (0 Gy) group. lncRNA indicates long noncoding RNA; mRNA, messenger RNA.

