Figure 4.

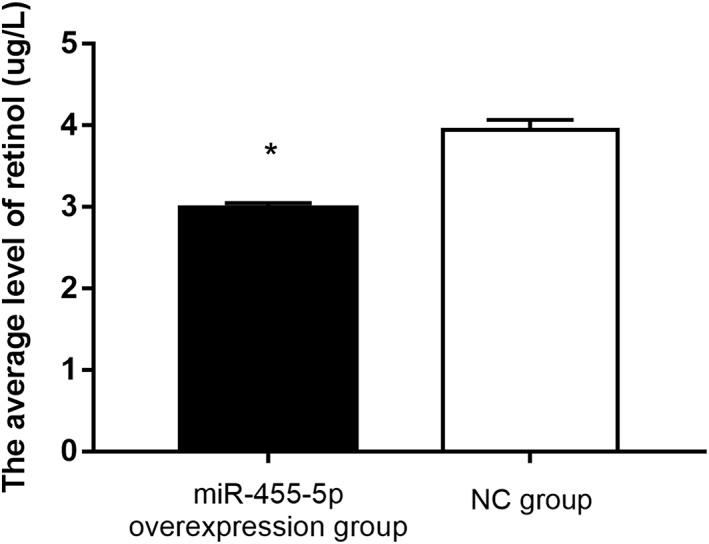
The retinol level the in the miR‐455‐5p‐overexpression group was significantly decreased compared with that in the NC group. “*” means P < 0.05.

The retinol level the in the miR‐455‐5p‐overexpression group was significantly decreased compared with that in the NC group. “*” means P < 0.05.