
Figure 6.
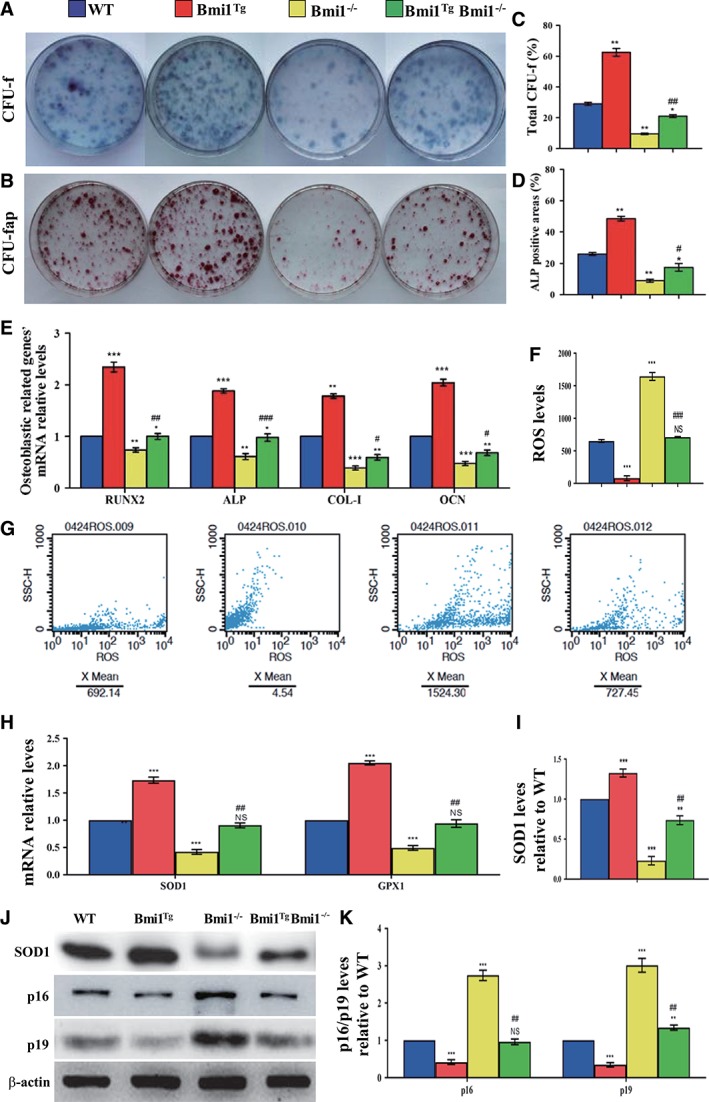
Effect of Bmi1 overexpression in mesenchymal stem cells (MSCs) on the proliferation and differentiation of bone marrow (BM) MSCs in Bmi1−/− mice.
Primary BM cells from 6‐week‐old WT, Bmi1Tg, Bmi1−/−, and Bmi1TgBmi1−/− mice were cultured ex vivo in osteogenic differentiation medium for 18 days and resulting cultures were stained with (A) methylene blue for total number of colonies (colony forming unit fibroblasts [CFU‐F]) and (B) cytochemically for alkaline phosphatase (ALP) to show CFU‐Fap. (C): Total CFU‐f‐positive areas and (D) ALP‐positive areas relative to culture dish area. (E): Real‐time (RT)‐PCR analysis of BM‐MSC extracts for the expression of Runx2, ALP, Col‐I and OCN. Messenger RNA expression assessed by RT‐PCR is expressed as a ratio to Gapdh expression. (F): Reactive oxygen species (ROS) levels in BM‐MSCs were determined by flow cytometric analysis. (G): Representative graphs of flow cytometry analysis for ROS levels in BM‐MSCs. (H): Gene expression levels of antioxidative enzymes. (J): Western blots of BM‐MSC extracts for expression of SOD1, p16, and p19. β‐Actin was used as loading control for Western blots. (I): SOD1 and (K) p16 and p19 protein levels relative to β‐actin protein level were assessed by densitometric analysis and expressed relative to levels of WT BM‐MSCs. Each value is the mean ± SEM of determinations in five mice of each group. *, p < .05; **, p < .01; ***, p < .001 compared with WT mice. #, p < .05; ##, p < .01; ###, p < .001 compared with Bmi1−/− mice.