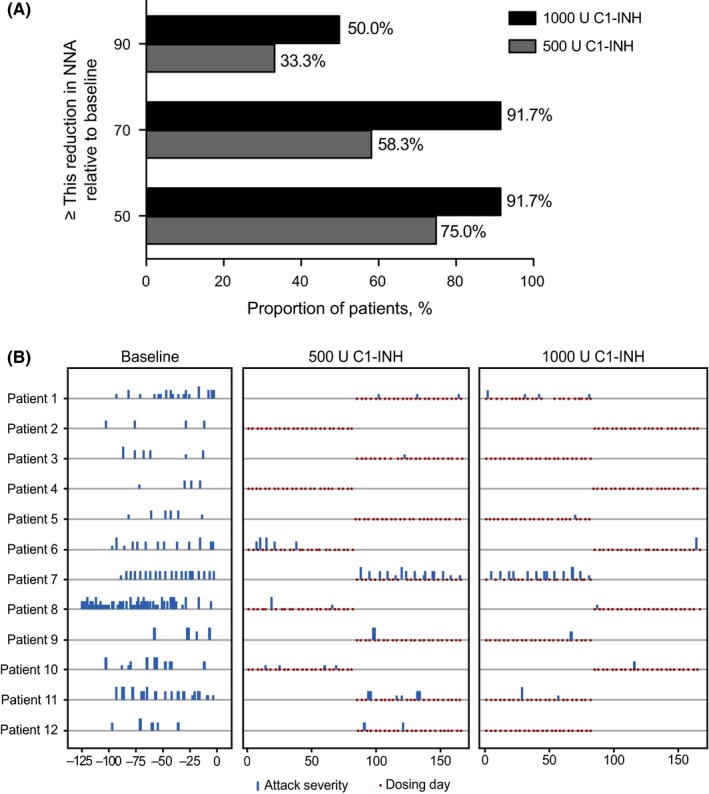
Figure 2.

A, Clinical response rate. Proportion of patients achieving at least 50%, 70%, or 90% reduction relative to baseline in NNA. B, Angioedema attack and severity profile of patients during baseline observation period and during treatment with 500 and 1000 U C1‐INH. Data for full analysis set shown (n = 12)
