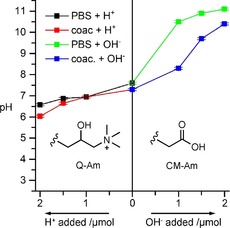
Figure 6.

The buffering capacity of the complex coacervate phase utilized in this protocellular system. The pH was determined by using a micro pH meter. The x‐axis represents the amount of acid or base added to the system from a 1 m stock solution (1 μL of 1 m stock is 1 μmol).
