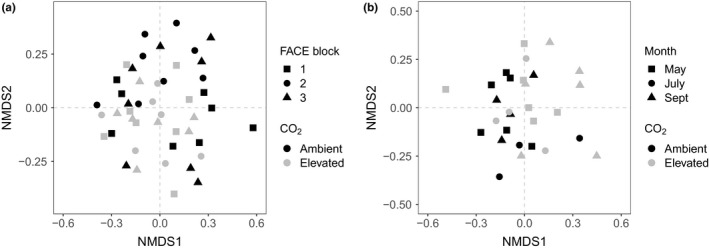
Figure 2.

Nonmetric multidimensional scaling (NMDS) plots for (a) spatial and (b) temporal samples from GiFACE. Black and grey symbols represent samples from aCO2 and eCO2 treatments, respectively. Square, circle and triangle symbols either represent samples from FACE ring blocks 1, 2 and 3, respectively (a), or samples collected in May, July and September 2013, respectively (b). Samples that appear closer together represent AM fungal communities that are compositionally more similar than those further apart
