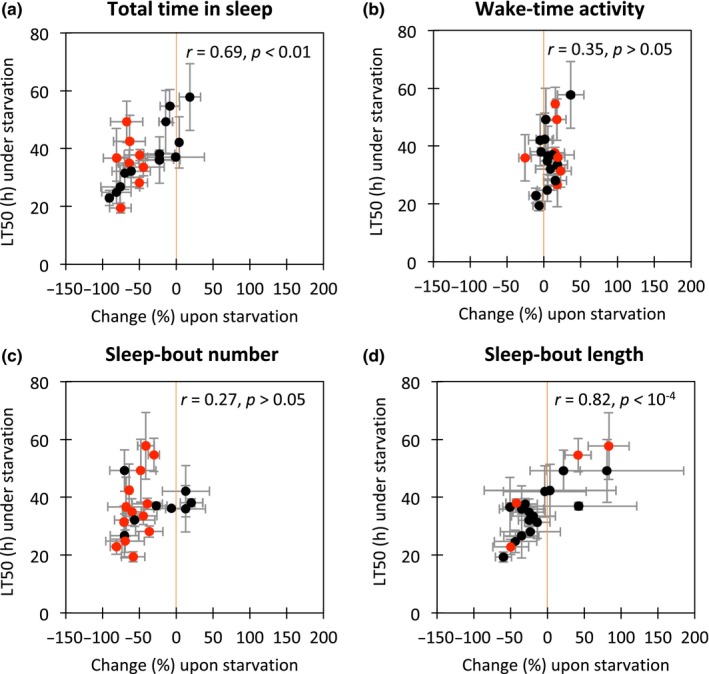
Figure 1.

The relationships between changes upon starvation in sleep‐related traits and survival time (LT50) under starved conditions among 21 lines from Katsunuma, Japan. (a) The relationship between change (%) in total time in sleep and the LT50 under starvation. (b) The relationship between change (%) in wake‐time activity and the LT50 under starvation. (c) The relationship between change (%) in sleep‐bout number and the LT50 under starvation. (d) The relationship between change (%) in sleep‐bout length and the LT50 under starvation. Pearson's correlation coefficient (r) is indicated in each panel. p‐values are adjusted for multiple testing (four tests) using the Bonferroni correction. All sleep‐related traits were analysed in the first dark period (D0, 12‐hr period beginning from approximately 6 h after starting the experiment). Error bars indicate standard deviations. Red circles indicate significant differences between starved and fed conditions (p < .05 by two‐way ANOVA after applying the Bonferroni correction for multiple testing (21 tests), Appendix S6). Orange lines indicate x = 0
