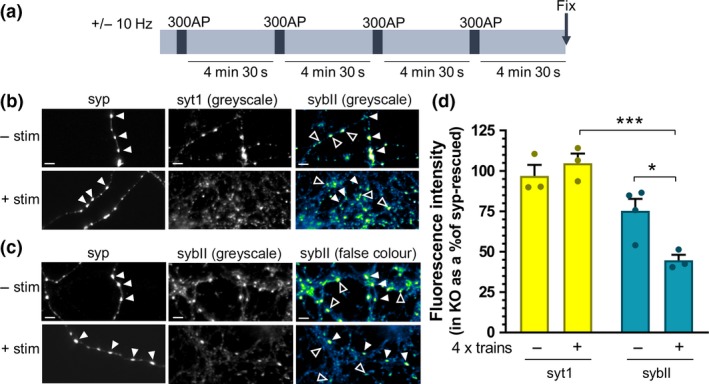
Figure 2.

SybII is de‐enriched from synaptophysin knockout nerve terminals during repetitive stimulation. Primary cultures of synaptophysin knockout (KO) hippocampal neurons were transfected with synaptophysin‐mCer (syp). Neurons were challenged with four trains of 300 action potentials delivered at 10 Hz at 5‐min intervals as shown in (a) or left to rest for an equivalent period. At the end of the final rest period, neurons were fixed. (b and c) Representative images of synaptophysin knockout neurons, transfected with syp and immunolabelled for anti‐GFP (which also labels mCer, to label syp‐transfected cells, left, greyscale) and either synaptotagmin‐1 (syt1; b) or sybII (c) (middle, greyscale image; right, false colour, with warmer colours indicating increased fluorescence intensity). Closed arrows indicate transfected nerve terminals, open arrows indicate untransfected nerve terminals. Scale bar indicates 5 µm. (d) Bar graph displaying the mean relative fluorescent intensity of either synaptotagmin‐1 (yellow) or sybII (teal) puncta of untransfected (KO) nerve terminals as a percentage of syp‐transfected (syp‐rescued) terminals from same field of view. Bars indicate SEM. (−) indicates neurons left at rest, and (+) indicates neurons that have undergone four trains of stimuli (all n = 3 independent experiments, one‐way anova with Sidak’s multiple comparison test; ***p < 0.001, *p < 0.05. syt1 (−) vs. (+) p = 0.8952; sybII (−) vs. (+) p = 0.0302; syt1 (−) vs. sybII (−) p = 0.1448; syt1 (+) vs. sybII (+) p = 0.0006. n indicates a single field of view from a single coverslip, assays were repeated across two independent cultures from independent animals).
