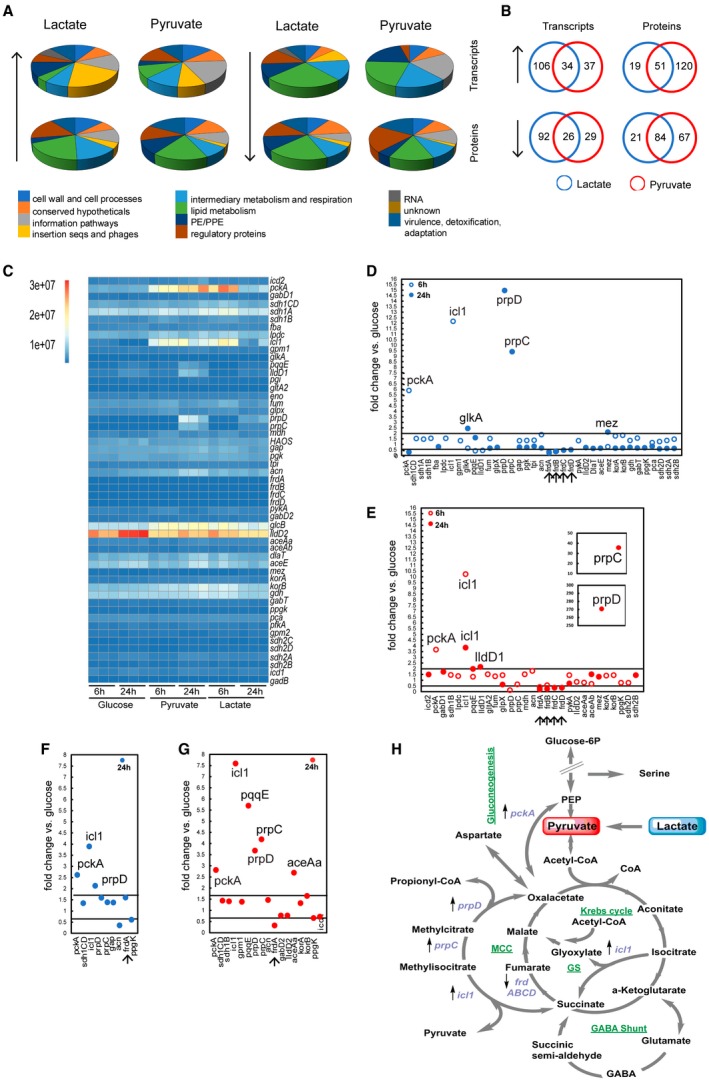
Figure 4.

Transcriptomics and proteomics reveal that Mtb utilises the glyoxylate shunt and methylcitrate cycle to metabolise lactate and pyruvate. A. The pie charts show the percentage distribution in each functional category of transcripts (top panels) and proteins (bottom panels) significantly (↑) up‐ and or (↓) down‐regulated at 24 h. The distribution is calculated using the total gene number per category as ‘the 100%’ value. B. Venn diagrams showing comparison of (↑) up‐ and/or (↓) down‐regulated transcripts/proteins in lactate and pyruvate at 24 h. C. Heatmap showing the abundance (absolute reads) of central carbon metabolism (CCM) gene transcripts. Each column represents the reads abundance from one independent experiment at the indicated time point and carbon source. D–G. CCM transcripts (D) and proteins (F) fold‐changes in lactate; CCM transcripts (E) and proteins (G) fold‐changes in pyruvate; the lines across the charts represent the chosen fold‐change threshold. We considered significant differentially regulated those transcripts with a fold‐change ≥2 and ≤0.5, and those proteins with a fold‐change ≥1.7 and ≤0.6. We chose a lower threshold for protein fold‐change because the tandem mass tags (TMT) labelling methodology used in this work ‘compresses’ the fold‐change magnitude. The arrows at the bottom of the plots indicate significant down‐regulated genes both in lactate and pyruvate. Only the statistically significant fold‐change values were reported (p < 0.05). H. Schematic representation of CCM pathways; the differentially expressed genes both in lactate and pyruvate are reported in violet with the arrow direction indicating the up (↑) or down (↓) regulation. MCC = Methylcitrate Cycle. GS = Glyoxylate Shunt. Transcriptomics and proteomics results shown were obtained from three and two independent experiments respectively.
