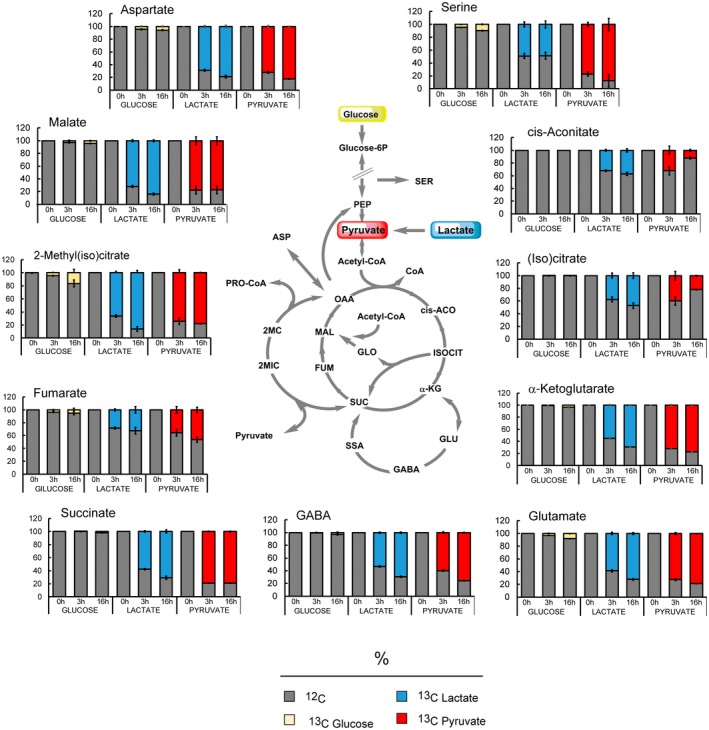
Figure 6.

Metabolomics reveals that Mtb uses the entire CCM network to metabolise lactate and pyruvate. Percentage of labelled (13C) and unlabelled (12C) metabolites detected in Mtb grown in glucose, lactate or pyruvate at the concentration of 0.4%. 0h represents the unlabelled sample extracted from cells grown 6 days in unlabelled (U‐12C) carbon source. ‘3 h’ and ’16 h’ represent the exposure time to labelled carbon source. The charts show the average and standard deviation of four biological replicates from one experiment, representative of three independent experiments. cis‐ACO = cis‐aconitate; ASP = aspartate; FUM = fumarate; GABA = gamma aminobutyric acid; GLO = glyoxylate; GLU = glutamate; α‐KG = α‐ketoglutarate; ISOCIT = isocitrate; MAL = malate; 2MC = 2‐methylcitrate; 2MIC = 2‐methyl‐isocitrate; OAA = oxaloacetate; PEP = phosphoenolpyruvate; PRO‐CoA = propionyl‐CoA; SER = serine; SSA = succinic semialdehyde; SUC = succinate.
