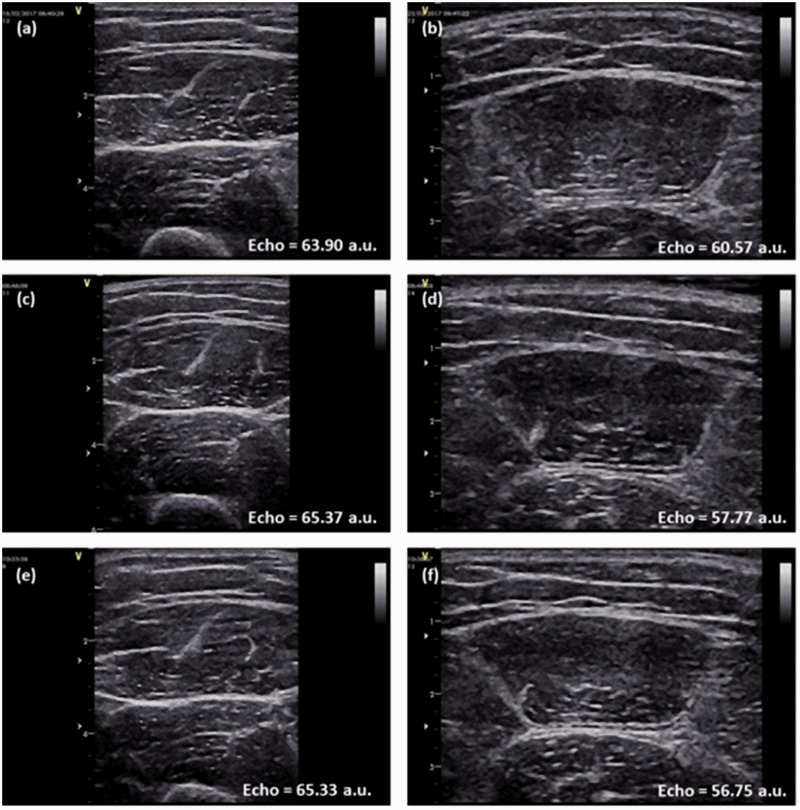
Figure 3.
Rectus femoris (RF) ultrasound images from one representative subject, obtained by the three raters at the two different muscle sites: (a) image obtained by R1 on RF50 site; (b) image obtained by R1 on RF70 site; (c) image obtained by R2 on RF50 site; (d) image obtained by R2 on RF70 site; (e) image obtained by R3 on RF50 site; (f) image obtained by R3 on RF70 site. Echo intensity values are presented in arbitrary units (a.u.).

