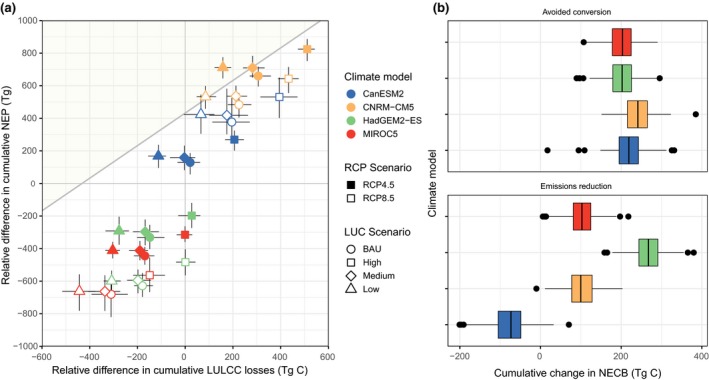
Figure 6.

(a) Relative effects of climate change (y‐axis; increasing from top to bottom) and land use and disturbances (including wildfire; x‐axis, increasing from left to right) for each of the 32 scenario simulations for the period 2017–2100. Error bars represent the Monte Carlo confidence intervals calculated for each scenario. Shaded area represents the area within the plot space where ecosystems were estimated to be a net carbon sink over the projected period. All values are cumulative over the simulation period and were rescaled as the difference from the mean of the 32 scenarios. (b) Box‐plot showing the change in total ecosystem carbon for each climate model when switching from high to low land‐use scenarios (top; local land‐use mitigation achieved through avoided conversion) and switching from the representative concentration pathway (RCP) 8.5 to RCP 4.5 radiative forcing scenarios (bottom; global mitigation). Box‐plots show the median (black bar), 25th and 75th percentiles (boxes), 10th and 90th percentiles (whiskers), and outliers (points). Negative values indicate a net loss of ecosystem carbon storage while positive values indicate net carbon sequestration. LULCC, land use and land cover change; NECB, net ecosystem carbon balance
