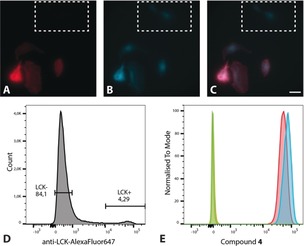
Figure 4.

Top: Images of A498 cells transfected with a plasmid encoding LCK and co‐stained with A) anti‐LCK‐AF647 and B) 4 (0.5 μm) with C) showing the overlay of the two channels. The white box shows non‐transfected cells as indicated by the absence of anti‐LCK‐AF647. Scale bar: 25 μm. Bottom: Analysis of K562 cells transfected with a plasmid encoding LCK using flow cytometry, monitoring the fluorescence of D) anti‐LCK‐AF647 from non‐transfected (LCK−) and transfected (LCK+) cells, and E) compound 4 from transfected (blue) and non‐transfected (red) cells. The orange and green peaks are the unstained controls (not treated with 4) for transfected and non‐transfected cells, respectively.
