Figure 2.

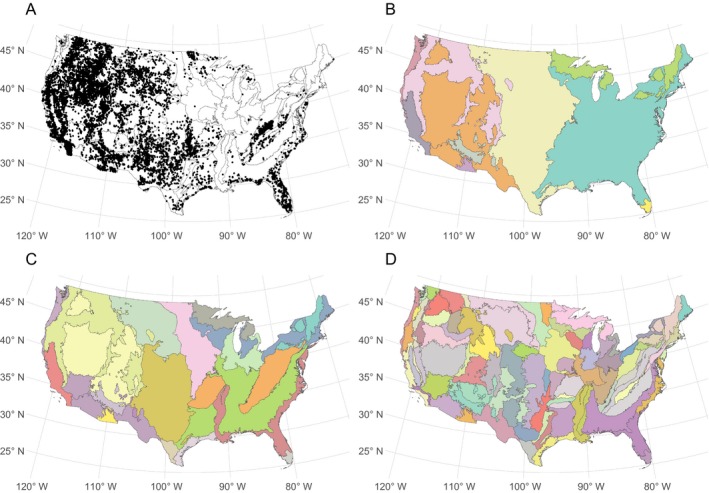
(A) Large wildfire ignition locations are shown as points across the study region. Colors in panels (B), (C), and (D) show level 1, 2, and 3 ecoregions respectively.

(A) Large wildfire ignition locations are shown as points across the study region. Colors in panels (B), (C), and (D) show level 1, 2, and 3 ecoregions respectively.