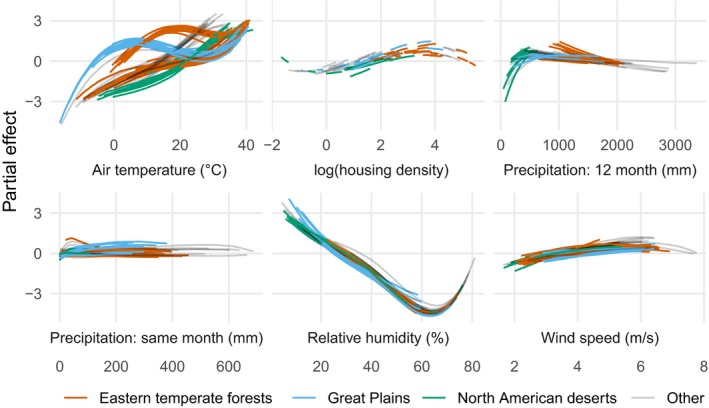
Figure 5.

Partial effects on the log‐transformed negative binomial mean component of the zero‐inflated negative binomial model for each level 3 ecoregion, colored by level 1 ecoregion. Lines are posterior medians. Results are similar for the zero‐inflation component. Housing density was measured as units/km2.
