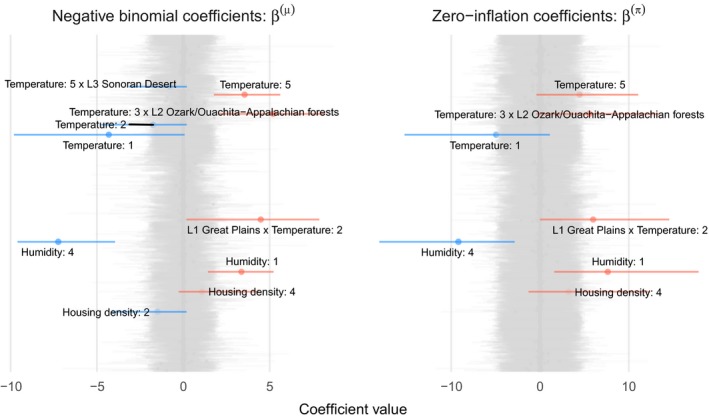
Figure 6.

Caterpillar plots of zero inflated negative binomial model coefficients, (left) and (right). Horizontal line segments denote 95% credible intervals. Gray segments indicate coefficients with a <87% posterior probability of being positive or negative, and colored segments indicate coefficients that are probably positive (red) or negative (blue). B‐spline vectors are indicated by colons, e.g., Humidity:1 indicates the first basis vector corresponding to humidity. Interactions between variables a and b are represented as a × b. Level 1 ecoregions are represented by L1 ecoregion name, and L2 and L3 indicate level 2 and 3 ecoregions.
