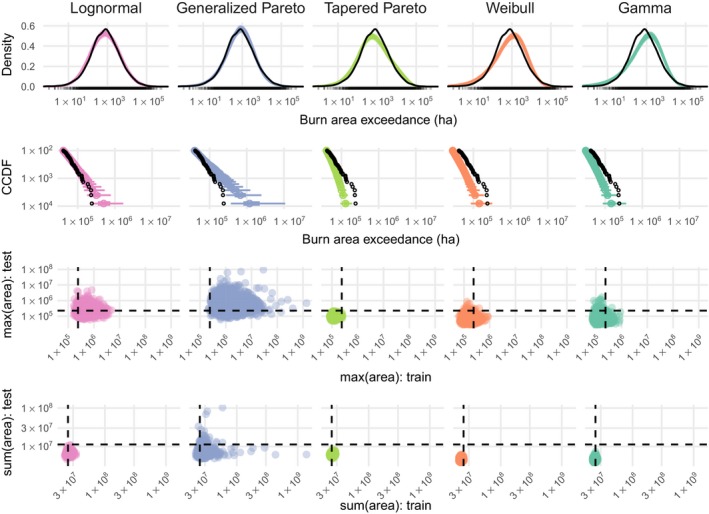
Figure 7.

Predictive checks for burned area models. The top row shows predicted density in color and empirical density for the training set in black, which reveals overall lack of fit for the gamma and Weibull models. Row two shows the complementary cumulative distribution function (CCDF) at the tails, with 95% and 50% prediction intervals shown in color and observed data as black points, which shows that the Generalized Pareto distribution predicts values that are too extreme. The third and fourth rows show checks for maximum and total burned areas in the training and test set, with observed values as dashed lines and posterior draws as colored points. These final two rows facilitate checks for summary statistics on both the training and test set, with the ideal model generating predictions (colored points) clustered close to where the dashed lines intersect.
