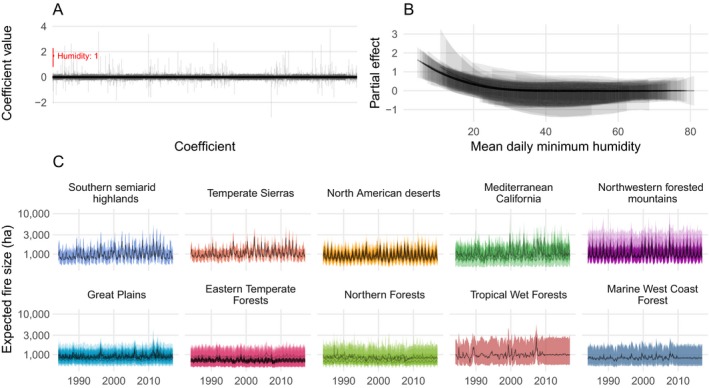
Figure 8.

(A) Estimated posterior medians and 95% credible intervals for each of the 3,473 coefficients associated with expected burned area. Only one coefficient, the first basis vector for humidity, had a 95% credible interval that excluded zero, shown in red. (B) Visualization of effect from panel A. Partial effects of mean daily minimum humidity for each level 3 ecoregion, with posterior medians drawn as lines, and the 95% credible intervals as ribbons. (C) Monthly time series of expected fire sizes for every level 3 ecoregion, faceted and colored by level 1 ecoregions sorted by mean humidity. Lines are posterior medians and ribbons are 95% credible intervals.
