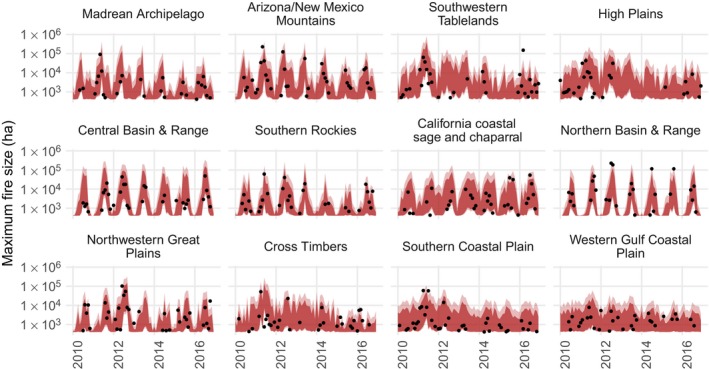
Figure 9.

Posterior 99% (light red) and 95% (dark red) prediction intervals for the burned area of the largest fire event by month and level 3 ecoregion in the test set, shown for ecoregions with wildfires in more than 20 months. Empirical maxima are shown as black dots.
