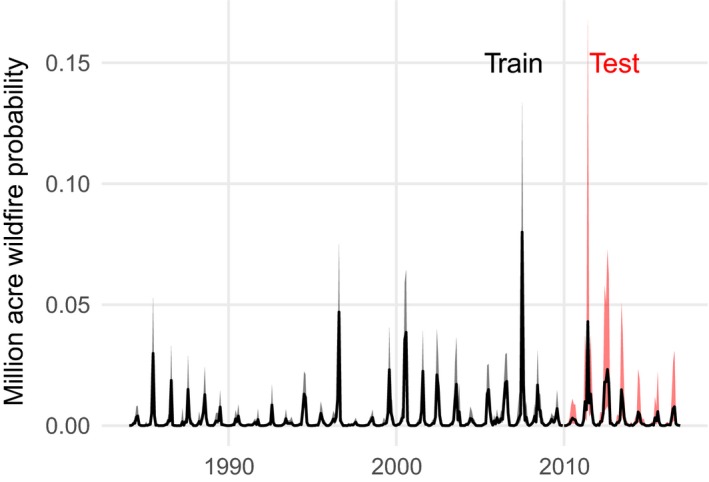
Figure 10.

Estimated monthly posterior probabilities that one or more fire events exceed one million acres (404,686 ha). The line represents the posterior median, and shaded region represents an 80% credible interval. The training period up to 2010 is shown in black, and the test period for which data were withheld during parameter estimation is shown in red.
