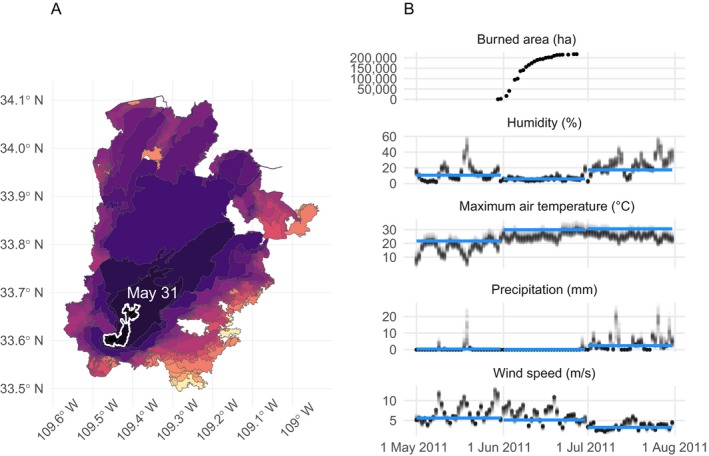
Figure 12.

(A) Progression of the Wallow Fire based on perimeter data collected from the GeoMAC database, spanning 30 May 2011 to 27 June 2011. The perimeter at the end of may is outlined in white, with brighter colors indicating later dates. (B) Daily local meteorological conditions and monthly regional mean conditions for the Wallow Fire, along with the associated burned area over time. The blue line represents monthly averages of meteorological quantities computed over the entire Arizona/New Mexico Mountains ecoregion, and black points represent values extracted for “local” 4‐km grid cells contained within the final burned area perimeter of the Wallow Fire.
