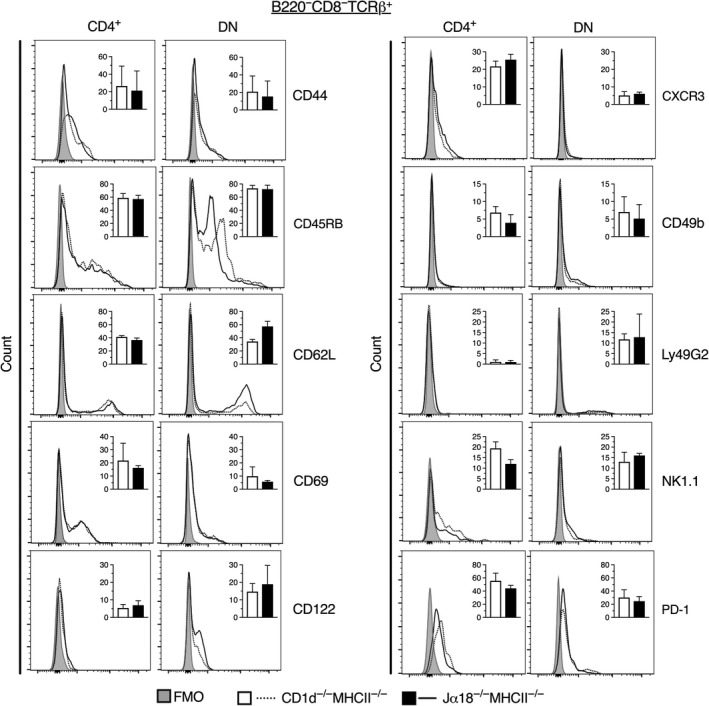
Figure 2.

Expression level of surface markers on CD4+ and DN TCRβ+ splenocytes from DKO mice. Spleen cells were prepared and stained for different surface markers. Representative flow cytometric histograms display the expression of indicated markers on CD4+ and DN TCRβ+ cells. Dotted lines represent CD1d−/−MHCII−/− mice, and solid lines represent Jα18−/−MHCII−/− mice. Shaded area shows FMO for background fluorescence. Inlet bar diagrams within the respective histograms are summaries of either three (CD44, CD45RB, CD62L, CXCR3, Ly49G2, NK1.1 and PD‐1) or four independent experiments (CD69, CD122 and CD49b), with a total of 6 and 8 mice, respectively, and expressed as mean frequencies of positive cells ± SD. White bars represent CD1d−/−MHCII−/− mice, and black bars Jα18−/−MHCII−/− mice. Statistics were analysed using Mann‐Whitney U test (two‐tailed)
