Figure 3.

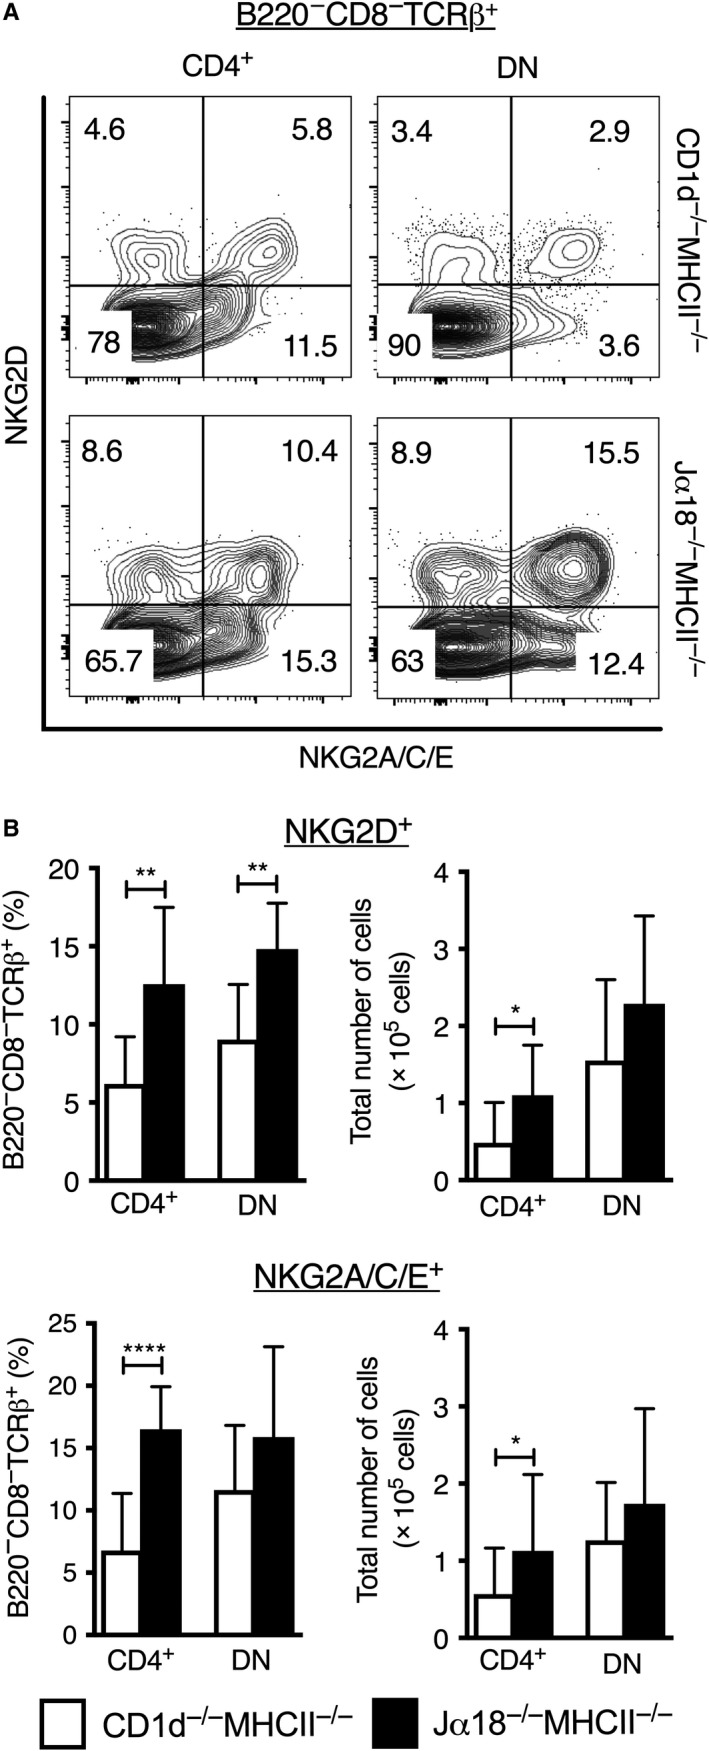
Increased expression of NKG2 receptors on CD4+ and DN splenic TCRβ+ cells in Jα18−/−MHCII−/− compared to CD1d−/−MHCII−/− mice. Spleen cells were prepared and stained for different surface markers. A, Flow cytometric plots display the expression patterns of NKG2D and NKG2A/C/E on CD4+ and DN splenic TCRβ+ cells from CD1d−/−MHCII−/− and Jα18−/−MHCII−/− mice. B, Frequencies among B220−CD8−TCRβ+ splenocytes gated as in (A) (left) and absolute numbers (right) of NKG2D and NKG2A/C/E expressing CD4+ and DN TCRβ+ cells. White bars represent CD1d−/−MHCII−/−, and black bars represent Jα18−/−MHCII−/− DKO mice. Results are expressed as mean ± SD of 8 mice from four independent experiments; * indicates P < 0.001, ** P < 0.001 and **** P < 0.00001 as calculated by Mann‐Whitney U test (two‐tailed). The flow cytometry plots of co‐expression of NKG2D and NKG2A/C/E on CD4+ and DN T cells in DKO strains shown in (A) is representative of two experiments
