Figure 4.

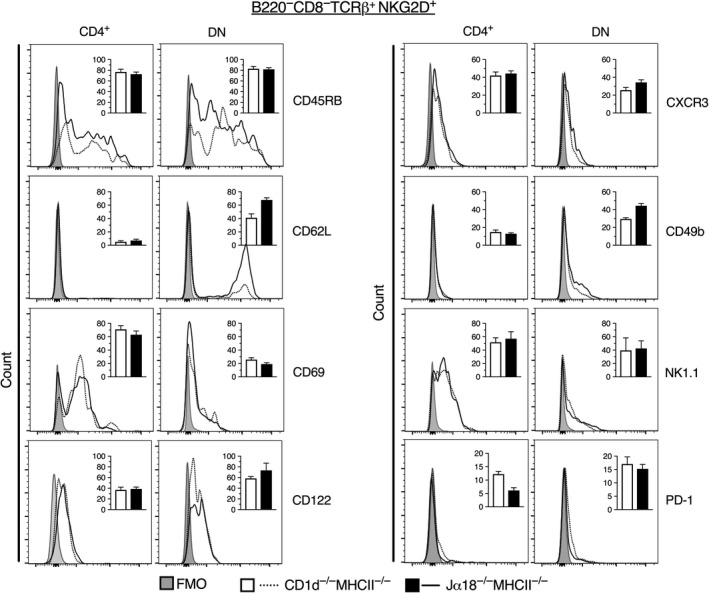
Expression of surface markers on NKG2D+ CD4+ and DN TCRβ+ splenocytes from DKO mice. Spleen cells were prepared and stained for different surface markers. Representative flow cytometric histograms display the expression of indicated markers on NKG2D+ CD4+ and NKG2D+ DN TCRβ+ cells. Dotted lines represent CD1d−/−MHCII−/−, and solid lines represent Jα18−/−MHCII−/− mice. Shaded area shows the FMO for background fluorescence. Inlet bar diagrams within the respective histograms are summaries of 6 mice from three independent experiments, and are expressed as mean frequencies of positive cells ± SD. White bars represent CD1d−/−MHCII−/− mice, and black bars Jα18−/−MHCII−/− mice. Statistics were analysed using Mann‐Whitney U test (two‐tailed)
