Figure 4.

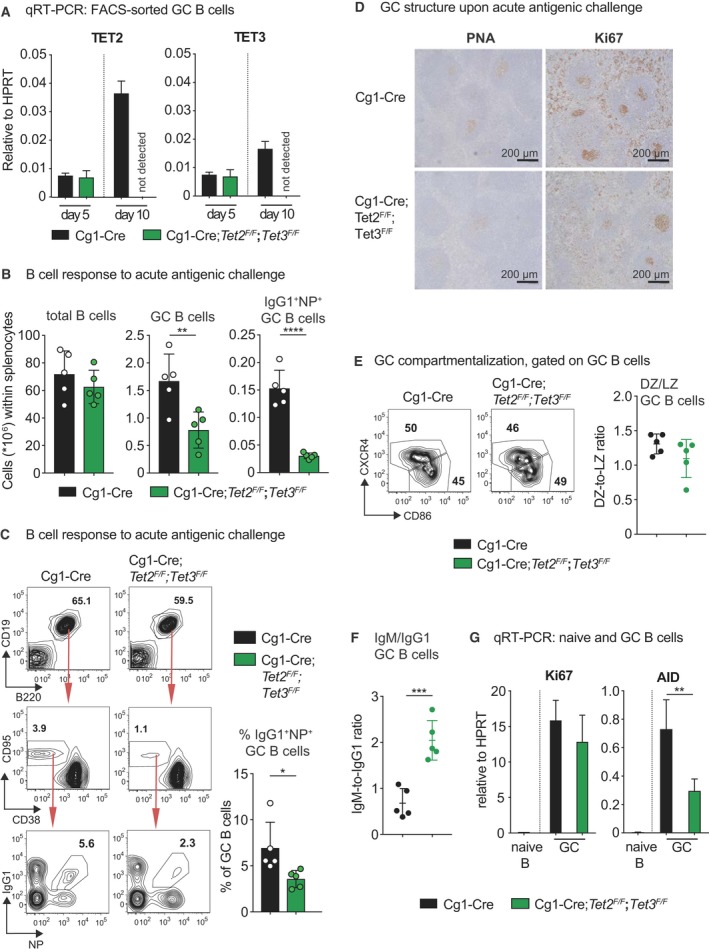
Loss of TET‐function impairs GC maintenance and CSR upon immunization. (A) qRT‐PCR analysis for TET2 and TET3 mRNA expression in FACS‐sorted splenic GC B cells of the indicated genotypes 5 and 10 days post immunization with NP‐CGG (n = 3 for Cg1‐Cre and n = 3 for Cg1‐Cre;Tet2 F/F;Tet3 F/F). (B) Mice of the indicated genotypes were immunized at the age of 8–10 weeks with NP‐CGG and analysed 14 days later. Flow cytometry analysis of splenic single‐cell suspensions identified the fractions of total B cells (B220+ CD19+), GC B cells (CD19+B220+ CD138− CD95hi CD38lo/−) and NP +IgG1+ GC B cells within total splenocytes. Total cell numbers for the respective cell populations are shown (n = 5 for Cg1‐Cre and n = 5 for Cg1‐Cre;Tet2 F/F;Tet3 F/F). (C) Representative flow cytometry plots (left) and bar graph (right; n = 5 for Cg1‐Cre and n = 5 for Cg1‐Cre;Tet2 F/F;Tet3 F/F) depict fractions of B cells, GC B cells and IgG1+ NP + GC B cells shown in (B). Arrows indicate gating strategy. (D) Spleen sections from the indicated genotypes 14 days post immunization with NP‐CGG were analysed for Ki67 (proliferating cells) and for the ability of cells to bind PNA (GC B cells). The brown precipitate indicates positive staining. Sections were counterstained with haematoxylin. One representative mouse out of three per group is shown. Scale bars: 200 μm. (E) Representative flow cytometry plots (left) depict fractions of DZ and LZ GC B cells within total GC B cells. Scatter graph (right; n = 5 for Cg1‐Cre and n = 5 for Cg1‐Cre;Tet2 F/F;Tet3 F/F) shows the ratio of DZ and LZ GC B cells. (F) Scatter graph depicts the ratio of IgM+ and IgG1+ cells within GC B cells (n = 5 for Cg1‐Cre and n = 5 for Cg1‐Cre;Tet2 F/F;Tet3 F/F). (G) qRT‐PCR analysis for Ki67 and AID mRNA in FACS‐sorted naïve Cg1‐cre B cells (n = 3) and GC splenic B cells (n = 3 for Cg1‐Cre and n = 3 for Cg1‐Cre;Tet2 F/F;Tet3 F/F) 14 days post NP‐CGG immunization. Data are shown as mean ± SD. *P < 0.05, **P < 0.01, ***P < 0.005, ****P < 0.0001 vs Cg1‐Cre control (Student's t‐test).
